
Viewing Activity
Navigate to Automations and select the Activity tab.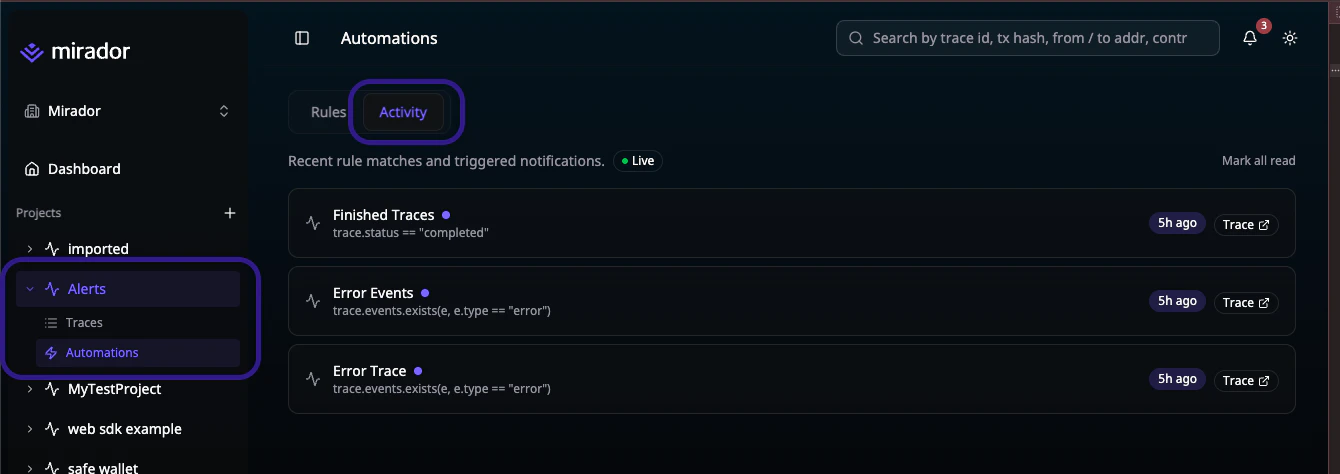
Live Updates
The activity feed updates in real time via a streaming connection. A Live indicator badge in the header confirms the stream is active. New matches appear at the top of the list with a New badge and are highlighted briefly to draw your attention.Read / Unread Status
Activity entries are marked as unread (indicated by a blue dot) until you’ve seen them. This helps you quickly identify what’s new since your last visit.- Mark all read — click the Mark all read button at the top of the activity list to clear all unread indicators
- Read status is persisted in your browser so it survives page refreshes
Navigating to a Trace
Click any activity entry to navigate directly to the trace that triggered the rule. This lets you quickly inspect the full trace details, events, and attributes to understand what happened.Understanding Match Reasons
The match reason column explains exactly which part of your rule’s conditions were satisfied. This is especially useful when rules have complex conditions with multiple clauses — the match reason tells you which specific condition triggered the alert. For example, if your rule checks for failed bridge transfers on ethereum, the match reason might show:
trace.tags contains "bridge" AND trace.attributes["status"] == "failed" AND trace.attributes["chain"] == "ethereum"
Tips
Next Steps
Rules
Create or edit automation rules
Integrations
Manage notification channels